Climate change debate; can we turn down the heat?
By Dennis Klocek 25 min read
There are many ways to think about the climate change debate and almost all of them lead to paradox and polarization. At the physical level of the debate, there are those who say that “greenhouse” gases have increased dramatically since the beginning of the Industrial Revolution. Greenhouse gases are gases that trap warmth in the atmosphere. These gases are produced both through natural processes and through human activity. Researchers who voice the “green” position link the rise in the greenhouse gases, particularly carbon dioxide produced by human technologies, with the recent rise of global temperatures.
The “ climate skeptics” concede that there is a calculable rise in carbon dioxide but that the science that links this rise to an anomalous rise in global temperatures is not rigorous. The primary skeptic objection is that most of the predictions made for temperature enhancement are flawed because of the inability of computer modeling techniques to reliably produce realistic climate analogs. A second objection is that even if there is a rise in global temperatures it is an error to attribute it to human activities.
These polarities have lead to posturing by leading proponents on both sides of the issue. This polarized level of communication obscures advances being made towards possible technology options that might be used in coming decades to stabilize atmospheric CO2 concentrations. Some of these new advances include increased efficiency in wind and solar energy technologies, biomass fuels as a way to both generate power and sequester carbon already in the atmosphere, and sustainable agricultural practices. The list also includes such exotic “green” studies as bio-mimicry where scientists study how to mimic naturally occurring carbon sequestering chains in nature and enhance their output. New applications of fungi and their host plants are being studied as a way to detoxify atmospheric pollutants. However due to the uncertainty that rests in the public domain on these issues these hopeful and creative solutions are minimized in the polarized debate that dominates the current scientific community.
We could ask the question, do the polarizations that surround the response to the problem of climate change come out of the physics of the issues or does the polarization phenomenon have roots in another dimension such as a fundamental challenge in the human soul itself? Contrary to the current empirical basis for science the alchemists and Rosicrucian adepts who studied the natural world in times past understood that the life of nature was a metaphor for the life of the human soul. Their outlook was that the human being was the cosmos writ small and that issues in nature were irresistibly linked to issues in the human soul. As below so above, as above so below, was the mantra that most typified this insight. Seen from the perspective that the symptoms of climate change are representative of a soul problem, the American tendency towards politicizing scientific debate and the misuse of facts to create a climate of uncertainty is troubling on more than just a physical level. Unfortunately, the misuse of facts is something that is happening on both sides of the issue due to a mind set towards fundamentalism as the basis for human consciousness globally.
These phenomena point to the need for considering a higher perspective for the climate change debate. Would the scientific issues change if a spiritual perspective that focused on the cosmological relationship between human beings and the life of nature was the basis for a research approach? Along these lines we could also ask that if the spirit in nature is really linked to the spirit in the human being what is the true nature of that linkage? From an esoteric viewpoint these questions about climate debate are actually at the root of many teachings about spiritual renewal and personal soul transformation.
Native Americans understood that humans came from the stars and needed to live in Nature in a sacred manner because as star beings they had a debt to the creator to oversee the Creation. At this level, the spiritual biography of human beings as a whole is intimately linked to the spiritual biography of the Earth as a living being. We are star beings who at the same time are children of Nature. Native peoples often called themselves “the people”. In this worldview, humans were the spirit people that came from the stars and would return to the stars when their bodies of flesh went back to the Earth. The Earth, in turn, was a spiritual being who supported this human sojourn into flesh through self sacrifice. Many indigenous religions were based on this fundamental insight of the destiny issues arising between the Spirit of the Earth and the human being as a spiritual entity. This kind of spiritual perspective is glaringly missing in the current debate on global warming that is primarily being waged through statistical argument.
Understandably, for contemporary analytical science seeing the Earth as a spiritual being seems naïve at best and alarmingly deceitful at worst. However it is possible to take a scientific approach to the study of the Spirit of the Earth by looking at climate patterns in the context of the motions of the planets. By linking planetary motions with the information gathered by climate analysis it is possible to form models that illustrate how the rhythms of climate patterns are linked to the Spirit of the Earth.
The following case studies describe several historic rapid atmospheric warming trends of the past century that were coincident with a remarkable series of planetary alignments. The intent is not to say that anthropogenic influences cited in current climate change debate are invalid. The intent is merely to illustrate that there are potential benefits from studying long term planetary sequences in the context of long term climatic events. The basis for this work is a geometrical technique called stereoscopic polar projection that is based on methodologies inherent in projective geometry. In projective geometry the relationship between a point and a plane is known as a projectivity. In making an Earth projectivity, a bundle of lines projected through a point situated at the South Pole can be projected through the Northern Hemisphere to a North Pole plane that touches the pole provided that the North Pole plane is parallel to the plane of the equator. This geometrical arrangement mathematically allows the curved Northern Hemisphere to be projected without distortion onto the flat North Pole plane. This is illustrated in the first figure.
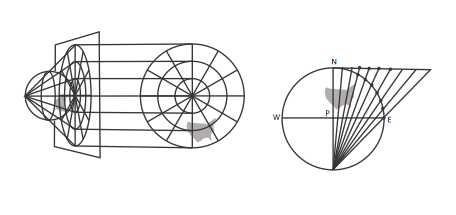
The chart depicts how it is possible to project a bundle of lines from the South Pole northward through the equator and beyond to the tangent plane at the North Pole. Such a projection accurately projects the land masses of the northern hemisphere onto the tangent plane at the North Pole. Geometrically this makes it possible to construct a map on the North Pole plane of every point on the Northern Hemisphere and have it arranged on the North Pole plane without any distortion. In effect it renders the hemisphere into a flat map with no distortion due to latitude. This is done without the need of spherical trigonometry. As a result of this technique a perfect circle drawn on the northern hemisphere will be projected onto the map on the polar tangent plane as a perfect circle in the exact placement that it occupies on the curved surface of the hemisphere. This method is used by government agencies to construct daily upper air charts of the whole northern hemisphere that show the positions of air masses without distortion regarding their extent and placement in longitude and latitude.
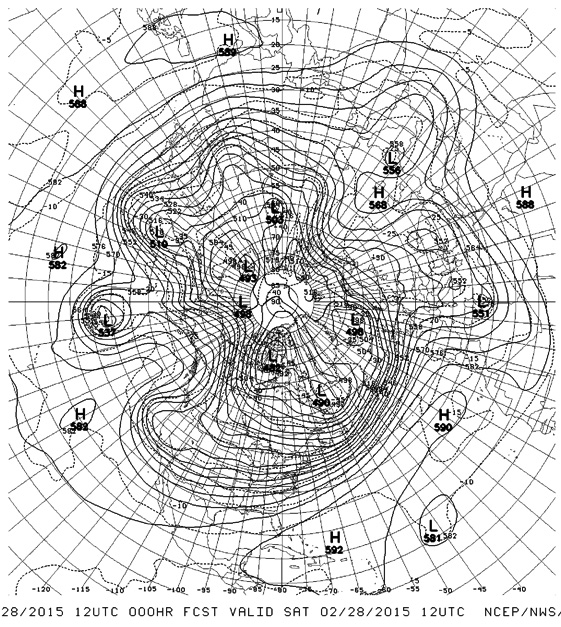
Chart 2 is an example of upper air maps that have served me as references since 1995 when I began to place a chart of the even house zodiac over them in order to determine if daily increments of the atmosphere could be associated with planetary motion. The North Pole is in the center of chart 2 with North America at 6 o’clock and Africa at 3 o’clock.. Over time with the help of the Astrosopher Brian Gray it has been possible for me to link particular terrestrial longitudes to planetary celestial positions in longitude reckoned sidereally. These placements have proved to come within 5°of placements being researched by Robert Powell and his associates and that has been a positive reinforcement for my efforts to maintain scientific accuracy for my work with the climate. The following studies make use of this polar projected zodiac in assessing the terrestrial placement of celestial positions through the 20th century.
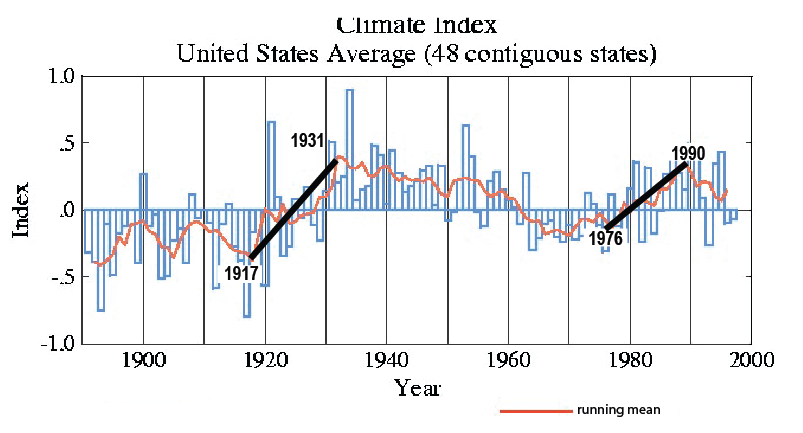
Chart 3 is a line graph of the temperature fluctuations in the US climate index for the 20th century. It has been taken from US government websites. The following charts show a robust coincidence between strong decadal shifts in US temperatures and the movements of Saturn, Jupiter and the node. This is a remarkable phenomenon that, to me, has great implications for future research on drought cycles.
If we look at the two periods in the last one hundred years in which temperatures for the climate index for the United States raised the most rapidly, the period between 1917-1931 and the period between 1975- 1990 (dark bars) stand out of the climate record. Comparing the planetary movement background for these two time periods reveals a remarkably similar set of motions between the lunar north node, Saturn and Jupiter.
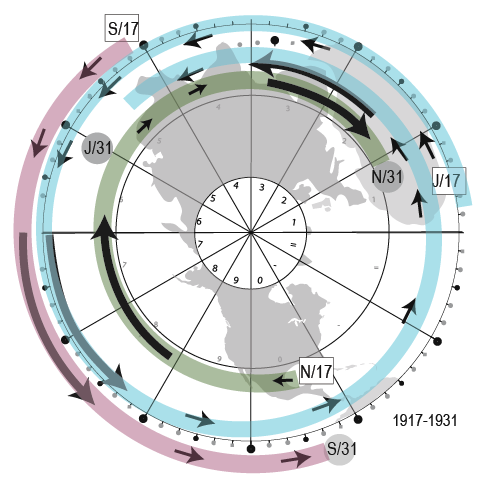
Chart 4 depicts the planetary motions that were coincident with the radical temperature rise between 1917 and 1931.
- Starting with the north node (green) projected over the Gulf of Mexico, its retrograde motion to the west starts in January 1917. This is designated as N/17. At the same time Saturn (pink) starting at S/17 over the western Pacific is moving east. Jupiter (blue) at J /17 begins moving east from western Africa. During the time of the event the node will move retrograde through nine zodiacal constellations. Saturn will move eastward through six constellations and Jupiter will move east through sixteen constellations. The chart shows the beginning and ending positions of each planet during the time frame of their motions.
- Jupiter overtakes Saturn in the mid Pacific in December 1919. The node, near Hawaii, is opposed to these two planets from December 1919 to August 1922 when it moves past them going west. This is illustrated with the dark arrows over the Pacific.
- Jupiter moves past Saturn in 1922 crosses North America and transits the Atlantic to once again encounter the node over central Africa in 1927. This is illustrated by the dark elongated arrows over the Mideast. This Jupiter / node opposition takes place opposite to the first opposition that also took place as Jupiter crossed Saturn. The final meeting of Jupiter and the node was over eastern Africa until June 1929 when they parted going in opposite directions. The US warming index chart shows a remarkable ascending grade of temperatures during the time of these two sets of conjunctions. The decade long Dust Bowl follows this sharp rise in temperatures. This in itself is just a symptomatic and coincidental pattern in planetary relationships as context for climate change.
The next chart depicts a similar planetary dance that was also related to a similar radical rise in US temperatures that were the precedent to the historic El Nino decade of the 1990’s.
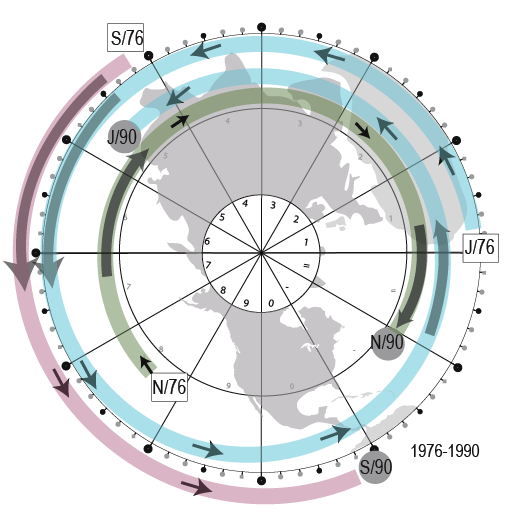
- In this chart the node (green) starts moving west from the eastern Pacific (N/76) in January 1976. Saturn(pink) begins moving east from the western Pacific (S/76) in January 1976. Jupiter (blue) begins moving east from western Africa (J/76) in January 1976.
- Jupiter overtakes Saturn in the western Pacific in September 1979. The node, in mid Pacific, is opposed to these two planets moving in tandem from May 1979 to November 1980, when it moves past them into the Indian Ocean. This conjunction is illustrated again by elongated dark arrows over the western Pacific.
- Jupiter moves past Saturn in 1980 and transits North America and then the Atlantic to encounter the node over the Azores in the eastern Atlantic. This Jupiter / node opposition takes place opposite to the first opposition. It is illustrated by the elongated dark arrows over the Azores. Jupiter moving direct then passes the node moving retrograde over western Africa in April, 1987. The event terminates in 1990.
- The remarkable decade long migration of warm water flowing from the western Pacific to the eastern Pacific follows this pattern of conjunctions and is coincident with a sharp rise in temperatures that led to several El Nino events in the decade of the 1990’s. In both climate scenarios it was the Pacific basin that was the site of anomalous warming events that was at the core of both the Dust Bowl and the decade of the strong El Nino events at the end of the century. The Pacific basin was the site of the intersection of Jupiter, the north node and Saturn in both of these anomalous climate patterns. From the perspective of hard science, these two very similar patterns could be called merely coincidental. However, the synchronous relationships between the motions and the resulting climate events that are so widely separated in time is a remarkable coincidence. Perhaps another set of charts can provide another angle on this issue.
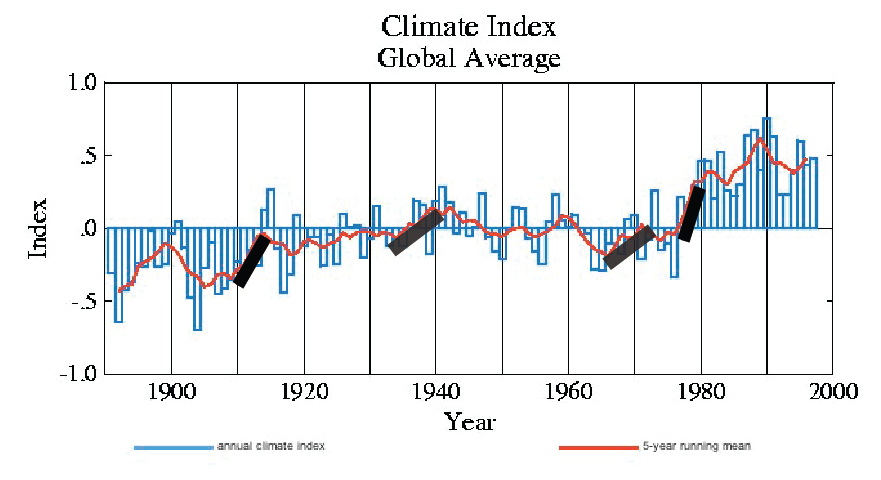
These case studies are meant to illustrate the more sedate temperature rises that can be seen in the global average temperature index. The chart shows a gradual rise in average temperatures across the whole globe for the century. However four periods stand out as radical surges .Those periods are highlighted by dark bars showing the slope of the warmth surge. The period 1909 to 1913 has a steep slope that is similar to the 1976 to 1979 temperature surge.
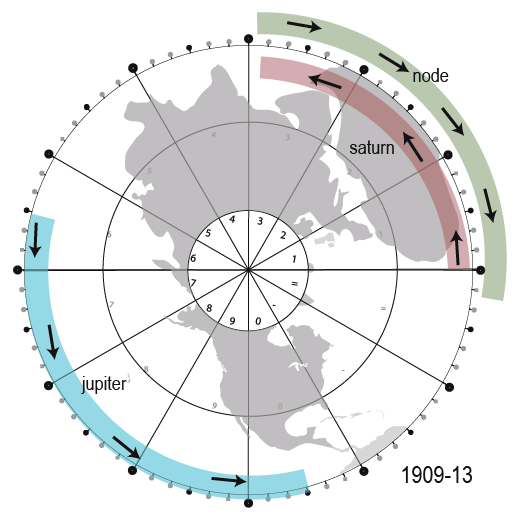
In chart 7 it can be seen that during the 1909-13 period there was a pattern that unfolded between Jupiter Saturn and the north node that was similar to the patterns illustrated earlier in this article. In 1909 to 1913 Saturn and the node over Africa opposed Jupiter over the east Pacific.
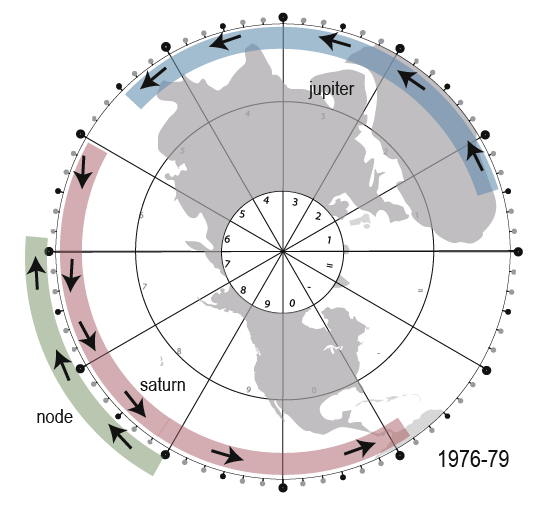
In chart 8 of 1976 to 1979 it can be seen that Jupiter is over Africa opposed to Saturn and the node over the east Pacific. In chart 5 the entire period 1976 to 1990 was illustrated. In chart 8 only a three year section is shown but the importance of that is that during those three years the whole globe experienced a significant warming. In chart 5 the western Pacific was the area where the most significant planetary interaction took place. Chart 8 shows that the initial three year opposition where the Saturn and the node opposed Jupiter in the central Pacific was an early seed for later warming to come into the eastern Pacific as the motions of these three planets slowly evolved towards the significant El Nino decade of the 1990’s.
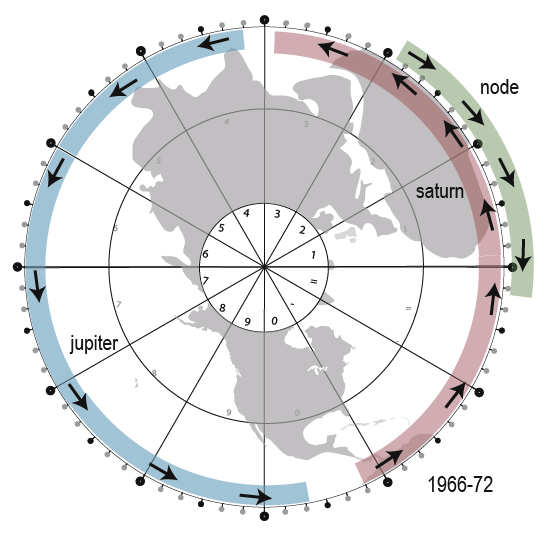
Chart 9 (1966-72) illustrates an opposition of these three influences focused on the dateline during the more gradual warming slope in global temperatures during those years.
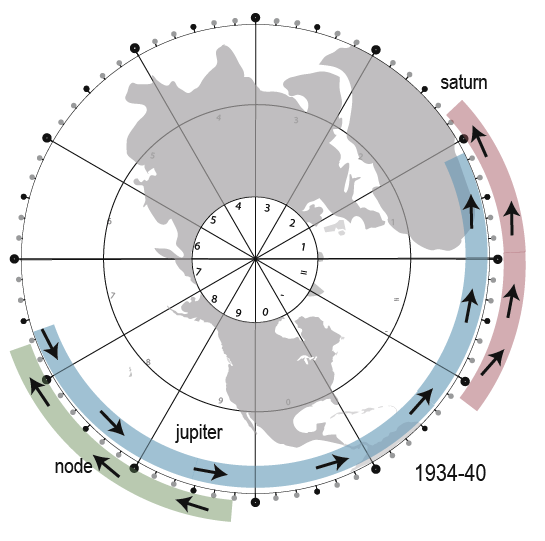
Chart 10 shows a weak opposition pattern of the node and Saturn and Jupiter over the eastern Pacific during the Dust Bowl years. From this opposition the warming was not just in the US but a global phenomenon. The opposition was weak and the warmth surge was more general. In the strong oppositions the warming response was strong in specific areas.
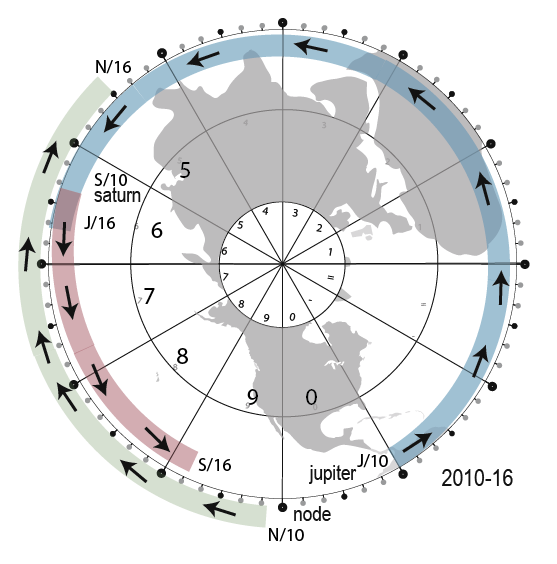
Chart 11 is a rendering of the planetary movements over the eastern Pacific in the time frame leading to the unprecedented drought conditions on the West Coast of North America that is currently (2015) in its forth year. A familiar pattern of planetary aspects emerges from this chart. In January 2010 Jupiter had ingress moving east into sidereal Aquarius (longitude of Florida) . Saturn began the year at 9° sidereal Virgo (mid Pacific). The node (moving west) stood at 7° Sagittarius (eastern Pacific) sidereally. In March 2011 Saturn at 19° Virgo opposed Jupiter at 19° Pisces. This took place on a meridian through the western Pacific. The node, starting in the eastern Pacific (N/10) moved west to the western Pacific (N/16). In that transit in July 2012 the node opposed Jupiter at 9° Scorpio west of Hawaii(mid Pacific). On September 2014 the node crossed Saturn at the dateline (mid Pacific). The chart shows the now familiar Jupiter, Saturn, north node configurations linked to past spikes in hemispheric temperatures.
It is useful at this juncture to point out that the Pacific with its long range fluctuation of El Nino and La Nina temperature phenomena is known to climatologists as the “hot box” for most of the Northern Hemisphere. This means that the condition of the eastern Pacific sets the tone for the rest of the global winds moving eastward from the West Coast of North America. This is why the meteorologists from Europe are experts in the maritime climate regimes of the West Coast of North America. In this context the opposition of Jupiter and Saturn over the eastern Pacific seems to be strongly coincidental with short and long term heat spikes both in the US and the whole northern hemisphere.
But that is not all. There is evidence that planetary movements have detailed links to the heat economy of the Pacific basin that produces periodic fluctuations known as El Nino/ Southern Oscillation(ENSO) events. To test this idea Sea Surface Temperature (SST) data was organized on monthly charts for every year going back to 1975. This temperature data was placed into the context of the standard longitudinal sections of the Pacific used by climate researchers. Those sections are nino4 to the west of the dateline, nino3.4 the dateline area, nino 3 near Hawaii and nino1&2 the eastern Pacific near the coast of North America
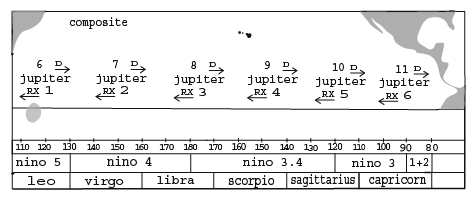
The monthly data for these longitudes was then interfaced with information from an ephemeris regarding the direct and retrograde motion of any planet that was moving anywhere in those longitudes at any given time. In setting up this data gathering schema it was surprising to learn that outer planets that were moving retrograde or direct over the Pacific formed their looping patterns in particular cadences as they crossed the Pacific. This insight gave a kind of yardstick in time that brought many interesting pictures into relief in the SST data grids. The composite chart illustrates this idea by depicting the longitudes of any outer planet moving in retrograde motion over the Pacific in any given year. It can be seen that outer planet loops form a kind of conveyor belt that moves the retrograde influence from the western Pacific in January, to the dateline area at midyear and then ends in looping patterns in the eastern Pacific in December. This placement is independent of the particular orbital period of the planet except for the specific degrees of longitude in arc that the planet covers in its retrograde motion between stations. The placement of a looping influence occurs when any outer planet forms a retrograde loop over the Pacific. As it gradually moves eastward through time its loop is like a time/space pause in a particular longitude.
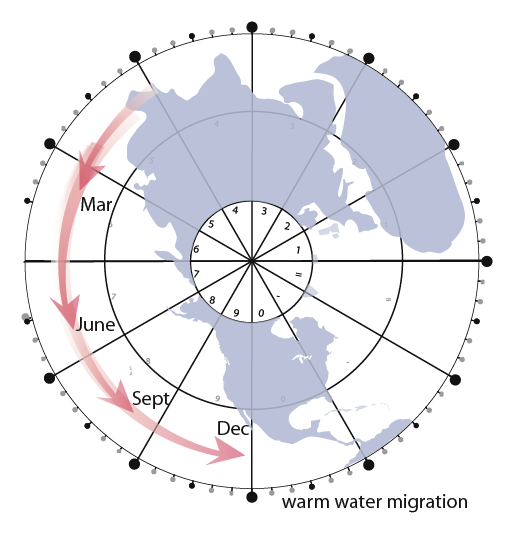
The next chart shows the Sea Surface Temperature (SST) migration of warm water from the western Pacific to the dateline each year along with approximate dates and longitudes of the warm water. This yearly migration is known as the canonical El Nino. In most years the canonical El Nino manifests a pool of warm water at the dateline at midyear. Then the pool slowly dissipates at the dateline in the fall. This is a failed El Nino in climatological terms but it is a yearly canonical feature of the ocean/ air linkages over the Pacific. When the El Nino makes a complete cycle the warm water makes its way to the west coast of South America by December. That phenomenon gives the migration its name because in Spanish El Nino refers to the birth of the Christ Child. My research has shown that the onset of a successful El Nino (ENSO) is often coincident with a particular arrangement of outer planets over the Pacific that harmonizes with the movements of the canonical migration of water and air. For this to happen there needs to be an outer planet going into retrograde motion over the Pacific west of the dateline early in the year, with another outer planet going into retrograde motion at midyear near the dateline and a final looping cycle of another outer planet over the eastern Pacific in the fall of the year.
The research has been to interface the duration and position of retrograde and direct motions across the Pacific with month by month SST data over the standard nino divisions of longitude used by climatologists. The studies have shown that these looping periods can be robustly linked to the onset of ENSO events of the past century. This is especially the case when the looping periods of Mercury, Venus and Mars are harmonically integrated into the motions of the outer planets. These time/ space periods then are remarkably consonant with the eastward migration of the warm water in a given year. This level of phenomena happens in extreme ways when inner planets looping periods fall in sync with a flotilla of well placed outer planets across the Pacific in a given year. For detailed illustrations of these basic phenomena please refer to the book Climate: Soul of the Earth published by Steinerbooks of New York.
The following study has arisen as a result of research related to retrograde motion over the Pacific. For the past seven years I have prepared a year in advance long range forecast for agricultural clients in Sonoma county through a weather service known as Climatrends. In doing the research for 2016 I was struck by the spread of planets that will be present in December of that year. The spread across the Pacific resembles some of the patterns present during the decade of the 90’s that resulted in significant El Ninos. When I began to detail the conditions that will be present in December 2016 and January 2017 the potentials for significant rains and floods became evident. So I decided to go out on a limb and make an El Nino flood prediction for the West Coast for December 2016 and January 2017. The rationale for this forecast is pictured in the following charts.

Chart 14 is for January 2016. Starting from the west Jupiter is placed at 28° Leo and is in retrograde motion. This is a critical placement to stimulate a backward motion against the prevailing westerlies. In past studies of SST response to a retrograde motion, it has been consistently observed that warm water arises to the west of the retrograde planet and the ocean to the east of the planetary position tend to cool. The warmth tends to stay in that longitude until the motion of the currents in the ocean gyres moves it towards the central Pacific in June and July. The building of warm water in western Pacific is enhanced when an outer planet is in retrograde motion for more or less five months west of the dateline. The Jupiter placement for January 2016 is considered to set a warmth seed in the western Pacific at that time to serve as the initial impetus of a successful El Nino.
In January, to the east of Jupiter, Mars is in direct motion at 3° Libra. This is the dateline area in nino4. The nino numbers are standard climatology references to positions in the Pacific. East of Mars is Saturn in the longitude of Hawaii in nino 3.4. East of Saturn, Venus is approaching the west coast of North America along with Pluto and Mercury. This spread has six planets stretched across the Pacific basin producing a scenario with El Nino potentials.

In chart 15 for March 2016 Jupiter is still in retrograde motion in the western Pacific and Mercury and Venus have moved east across the Gulf of Mexico and are now transiting the western Atlantic so they don’t appear on the Pacific chart. Pluto is still direct in the eastern Pacific. However, near Hawaii, Mars is approaching Saturn as Saturn shifts to retrograde motion. This means that the forward or direct (west to east) motion of Mars will be opposed to the retrograde (east to west) motion of Saturn in the longitude of Hawaii. This creates what I call a squeeze pattern. Research has repeatedly shown that squeeze patterns tend to enhance warm SST potentials between the two planets even more than simple retrograde motion. This event in mid March puts a warmth potential in the ocean between the two planets at a critical time for El Nino development. This is a further El Nino signal in the year 2016.

Chart 16 shows the developments of late May early June. This is a critical time frame in the development of an El Nino. In most years any warmth from the western Pacific tends to settle at the dateline in late May or early June and doesn’t move east of the dateline to impact the west coast of South America in December. What is needed to complete the cycle of migration is an impulse that enhances warmth at the dateline and then a pattern of motion that continues a wave like movement eastward from June to December. In the chart, Jupiter has shifted from retrograde motion to direct motion in the western Pacific. Research has shown that any warmth in the ocean tends to migrate to the east of a planet that has shifted from retrograde to direct motion. In the chart it can be seen that the direct motion of Jupiter is opposed to the retrograde motion of Mars in late May early June. The two planets are separated by 80° of arc so this is not a particularly strong squeeze but Mars will stay in retrograde motion for quite a while and as this squeeze progresses the dateline area should continue to warm up into June. By the end of June Mars will oppose Jupiter just west of the dateline by 60° of arc. By the end of June the Pacific will be covered by five planets sitting in the east but moving west against Jupiter sitting in the west but moving east. Warmth should develop from this near the dateline. This is another signal for a successful El Nino in 2016.

Chart 17 for August signals the emergence of a robust set of forces that can move warm water from the west to the east. Jupiter has left the Asian continent in direct motion and is now over water and as it moves east Mercury and Venus also move off of the Asian continent, cross Jupiter and begin rapid motion eastwards towards the dateline. At the same time Mars, in a position east of the dateline, has been approaching Saturn near Hawaii and in a remarkable coincidence conjoins Saturn within a few days of the conjunction of Mercury and then Venus with Jupiter to the west. Timing like this is a strong trigger for change in the ocean / air linkages. But there is more, because a critical warmth event takes place as Mercury moving east goes retrograde just as it has passed Jupiter. Mercury turns and moving west against Jupiter in the western Pacific instigates another powerful squeeze. This should further enhance warmth at the dateline. It also will tend to inhibit the easterly flow of water so any El Nino pattern will likely appear to stall at that juncture. However, the Pacific just to the west of the dateline should be a hotbed.
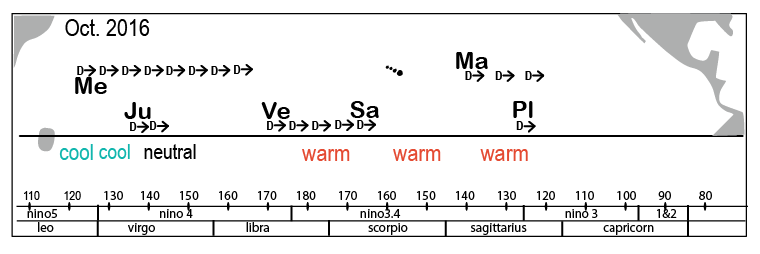
By October the building of warmth in the Pacific should be significant. What is needed for an El Nino to bloom in December is a strong west to east push from planets through the fall. Starting from the west, the October chart shows Mercury in a rapid transit of Jupiter moving eastward to the dateline. In the same time frame Venus moves from the dateline to Hawaii and intercepts Saturn as they both conjunct at the end of the month. Just a bit further to the east Mars is moving into the West Coast of North America into late conjunction with Pluto. This is a continuous and intense west to east series of planetary movements across the Pacific at the onset of the fall. If past scenarios hold true there should be a strong current of warm water moving from the dateline towards South America at that time.
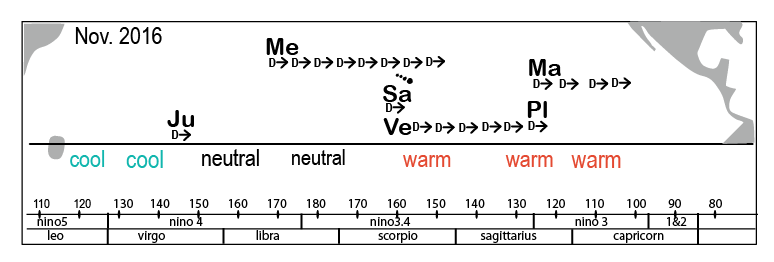
Chart 19 for November shows Mercury crossing Saturn near Hawaii, Venus crossing Pluto in the eastern Pacific and Mars approaching Central America. This is a further intensification of the west to east motions that characterized the October chart.
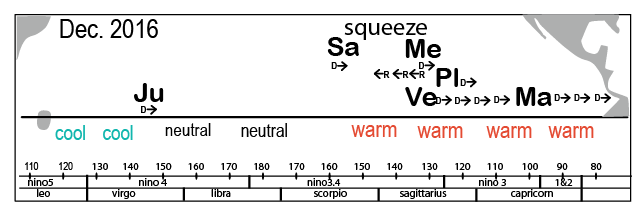
Chart 20 shows December, the month of the El Nino. In 2016 the west to east rush of planets towards the coast continues until the 19th when Mercury goes retrograde in the eastern Pacific. In past El Ninos this kind of last minute reversal has held off the onset of storm patterns until the retrograde planet again moves into direct motion. The great El Nino of 1998 was held off by a tandem retrograde movement of both Venus and Mercury in December. The western Pacific was boiling, a strong tongue of warm sea water was pushing against the coast of South America but no storm energies were unfolding on the West Coast of the US. Then Mercury went direct but nothing of significance unfolded. By that time conventional forecasters began to doubt that the El Nino was going to deliver. However the day that Venus went direct the first of a series of storms came into the West Coast and the much awaited event took place vigorously.
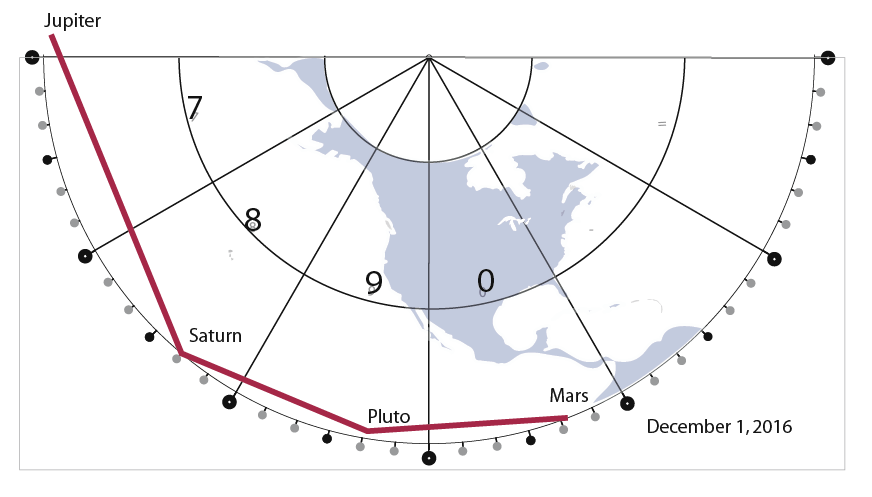
The planetary harmonic patterns for December 2016 are very much in support of the unfolding of anomalous rains. Starting in the west on December 1, Jupiter at 21° Virgo is 60° from Saturn at 22° Scorpio. Saturn at 22° Scorpio is close to 30° from Pluto at 21° Sagittarius. Pluto is 30° from Mars at 21° Capricorn. These are remarkable harmonic wave like placements at the beginning of the month. However, it may be that once again a retrograde planet over the eastern Pacific holds off the storm jet from delivering much needed rains. If that is the case then when Mercury goes direct on Jan. 3, 2017 the new year may get off to a very memorable, wet start. In any case the end of 2016 looks to be an interesting time for climate studies.
These ideas are offered to raise the point that there might be a dimension of the climate change issue that relates to transcendent spiritual values linked to planetary influences. In other words, what if climate change and El Nino and the other phenomena that are causing such concern today could include the perspective of being robustly linked to planetary influences? If we take that thought into an esoteric dimension, is it possible that human beings are wedded to the destiny of the Earth in such a fundamental way that the rhythms of the orbiting planets that form the spiritual context for the Earth as a living being are urging human beings to strive towards a higher plane of dialogue about global issues? And a final question, can humanity reach planes of thought related to the spiritual mission of the Earth Being as a vector of scientific research? The hope in these studies is that observations of physical phenomena that can be related robustly to planetary influences on climate patterns could become another aspect of the current scientific, political and religious debate around climate change.

Dennis Klocek
Dennis Klocek, MFA, is co-founder of the Coros Institute, an internationally renowned lecturer, and teacher. He is the author of nine books, including the newly released Colors of the Soul; Esoteric Physiology and also Sacred Agriculture: The Alchemy of Biodynamics. He regularly shares his alchemical, spiritual, and scientific insights at soilsoulandspirit.com.
Similar Writings
Eclipse Paths and Tectonic Plates: An Observation of Current Events
I found these two charts worth considering during the annular eclipse today. The one on the right shows the path of totality of the eclipse between Mt. Lassen and Mt. Shasta in northern California. In the chart on the left that path is traced on a seismic map. The black line is the path of…
Gems, Light, and Cosmic Will
Most human beings tend to value thinking as the most powerful human soul capacity because most problems are addressed through some level of thinking. Underneath awake thinking consciousness flows a constant river of will that evades awareness. Will is the force nature uses for changing things. In the human soul, will is the force of…